Getting Started
Welcome to the help documentation for MOMDYN. This page gives an overview of the user interface in the app. Here we will introduce tutorials that demonstrate the basics of building a dynamics model. This is followed by a discussion of the screens in the app, and some of the details of the interface. For detail on the physical components, check out the section on the Mechanism Module.
Tutorials
Below are examples of a simple pendulum and mass-spring-damper. These are standard models that are taught in dynamics and vibration coursework, and are used to teach the fundamentals of kinematic definition with translational and rotational motion, and equation of motion generation for specified bodies and loads. The tutorials introduce definition kinematics using the classic interface, followed by mechanical joints.
Welcome Screen
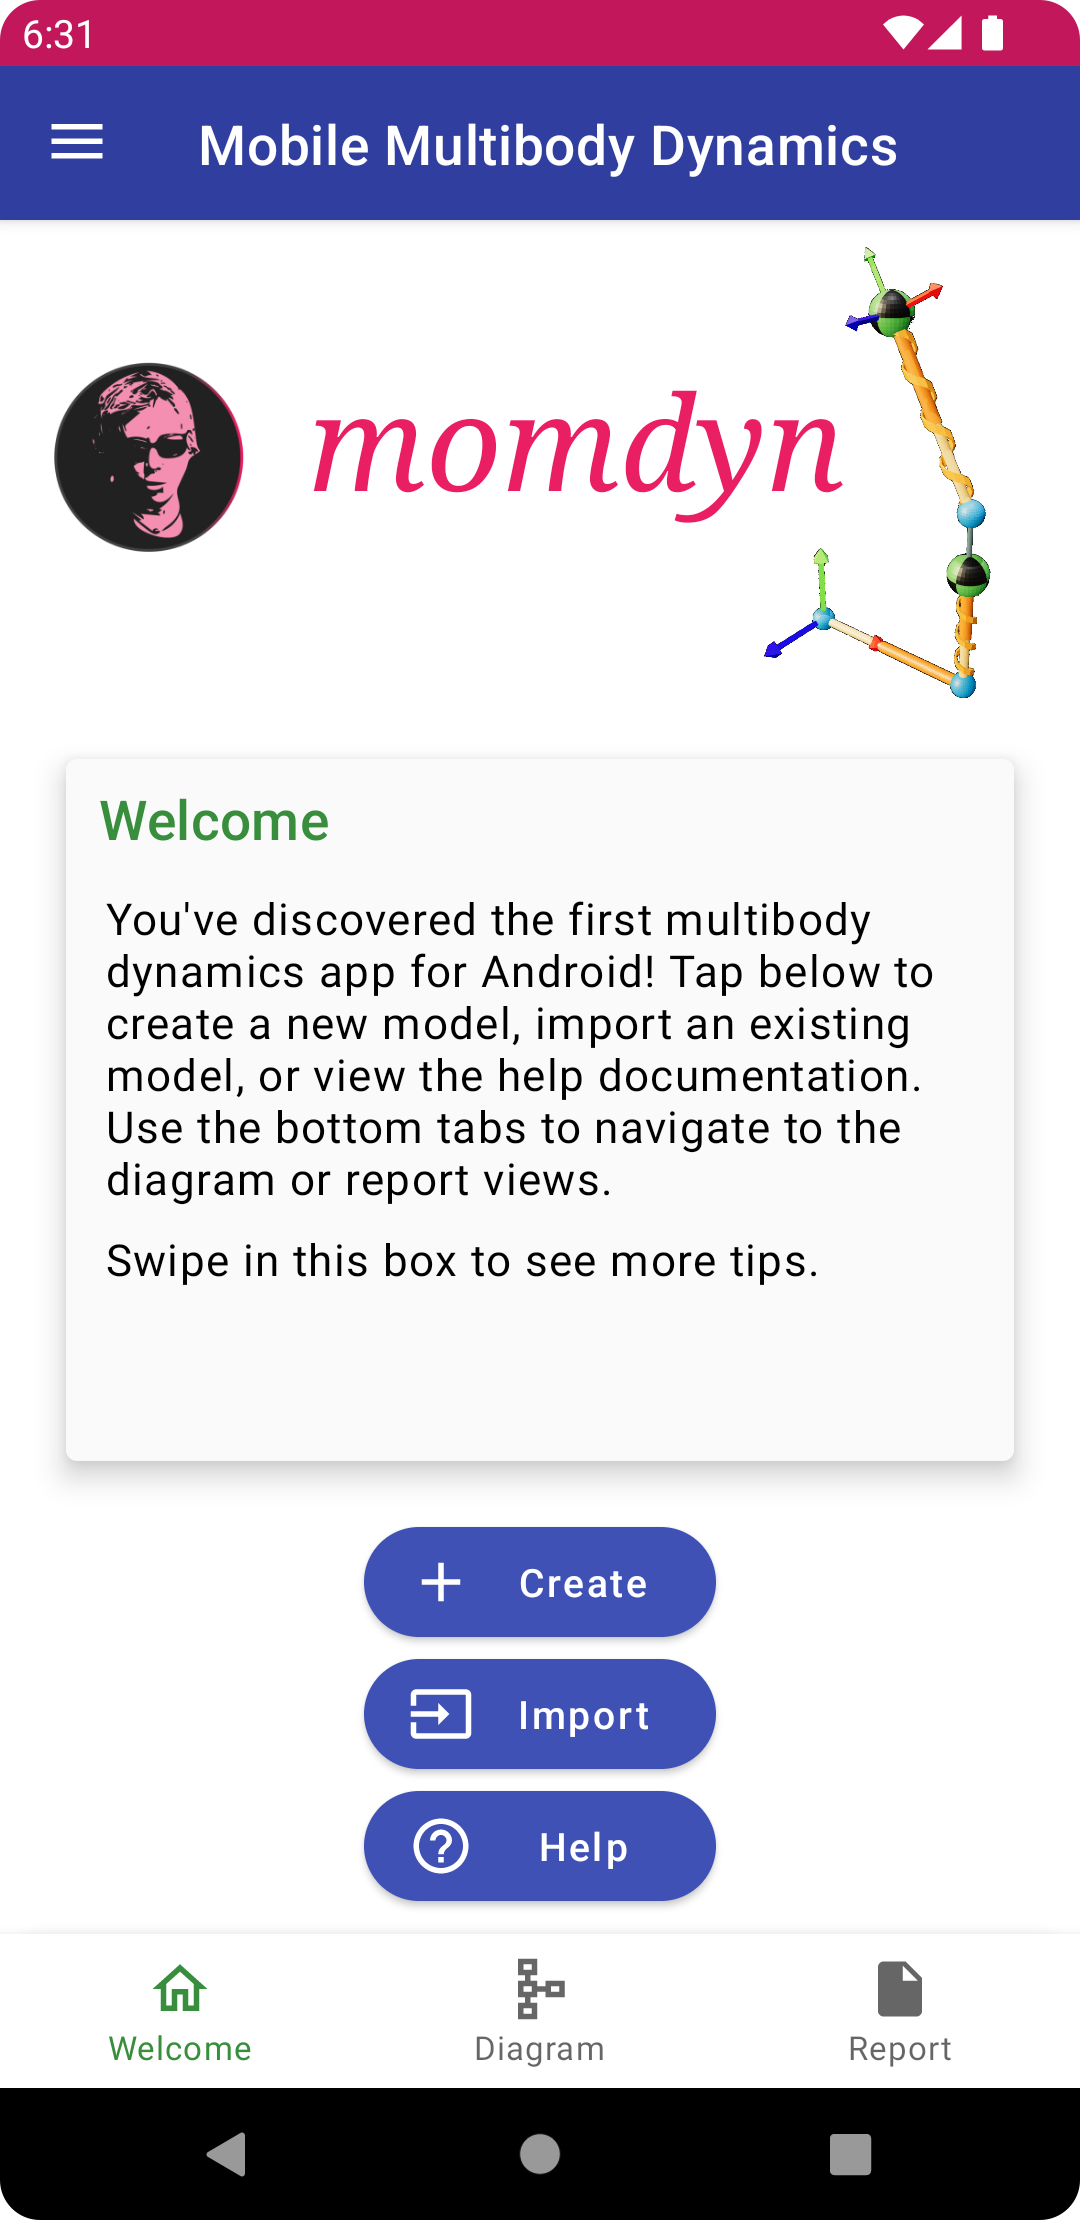
The first screen you see, with the three basic options, “Create,” “Import,” or “Help.” Tap on the first button to bring up the settings dialog, where you will configure a new model. Tap on the second button to bring up the import dialog, with a list of pre-created examples that are packaged with MOMDYN, as well as any models you have saved as a user. Lastly, tap on the third button to open a popup with a link to this site, and two tutorials.
Welcome Menu
Diagram View
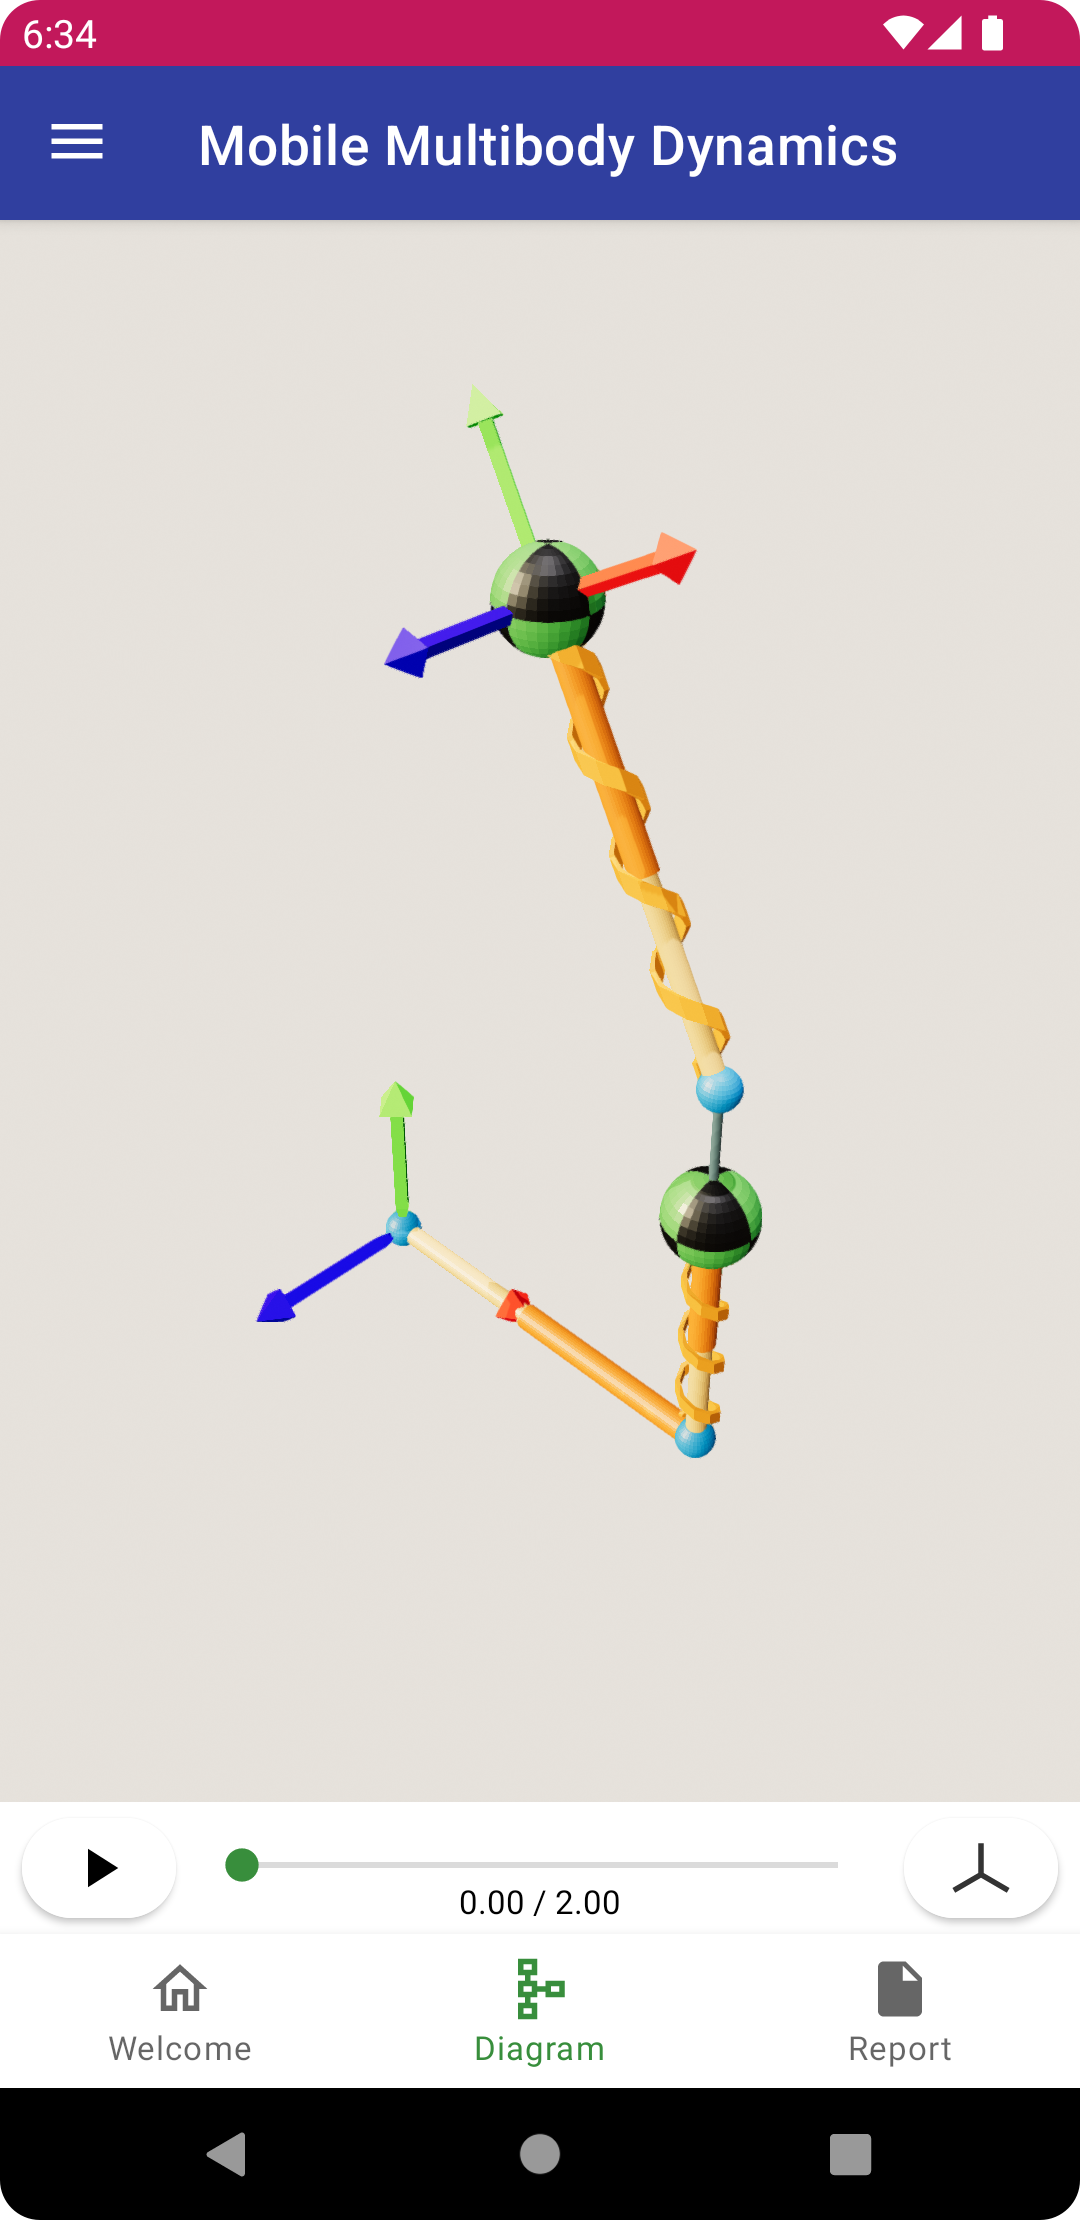
The primary screen for interacting with the model. Drag in the center of the screen to rotate the model, drag with two fingers to pan (translate) the model, and use the button in the lower right to zoom in, or zoom out. The menu button in the upper left opens the navigation drawer, with options to modify settings or export the model, and panels for each of the dynamics modeling components. The play button in the lower left is used to derive equations of motion (EOM), simulate, and start animations. Tap on the slider bar on the bottom to reposition the animation in time.
Contents:
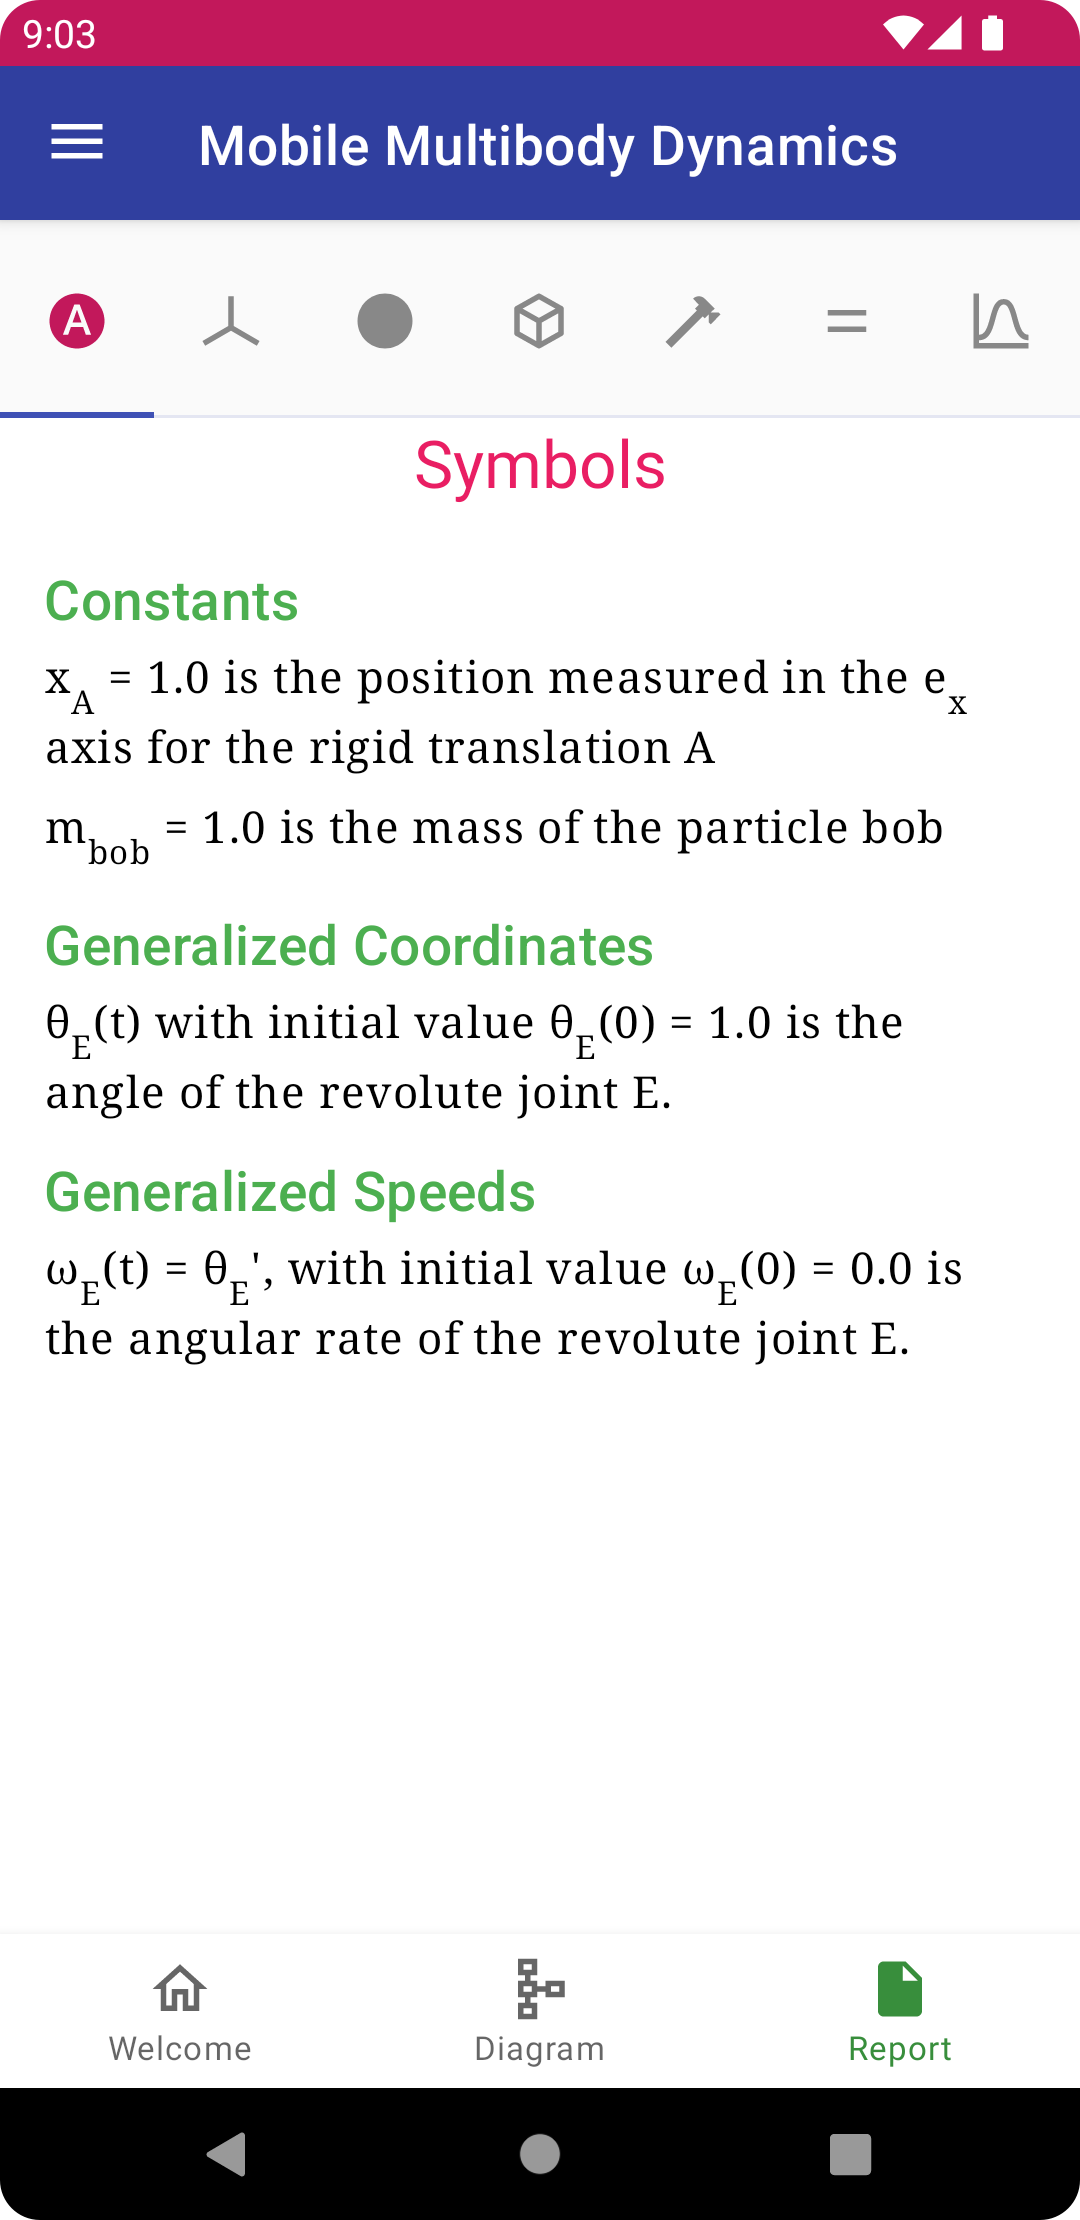
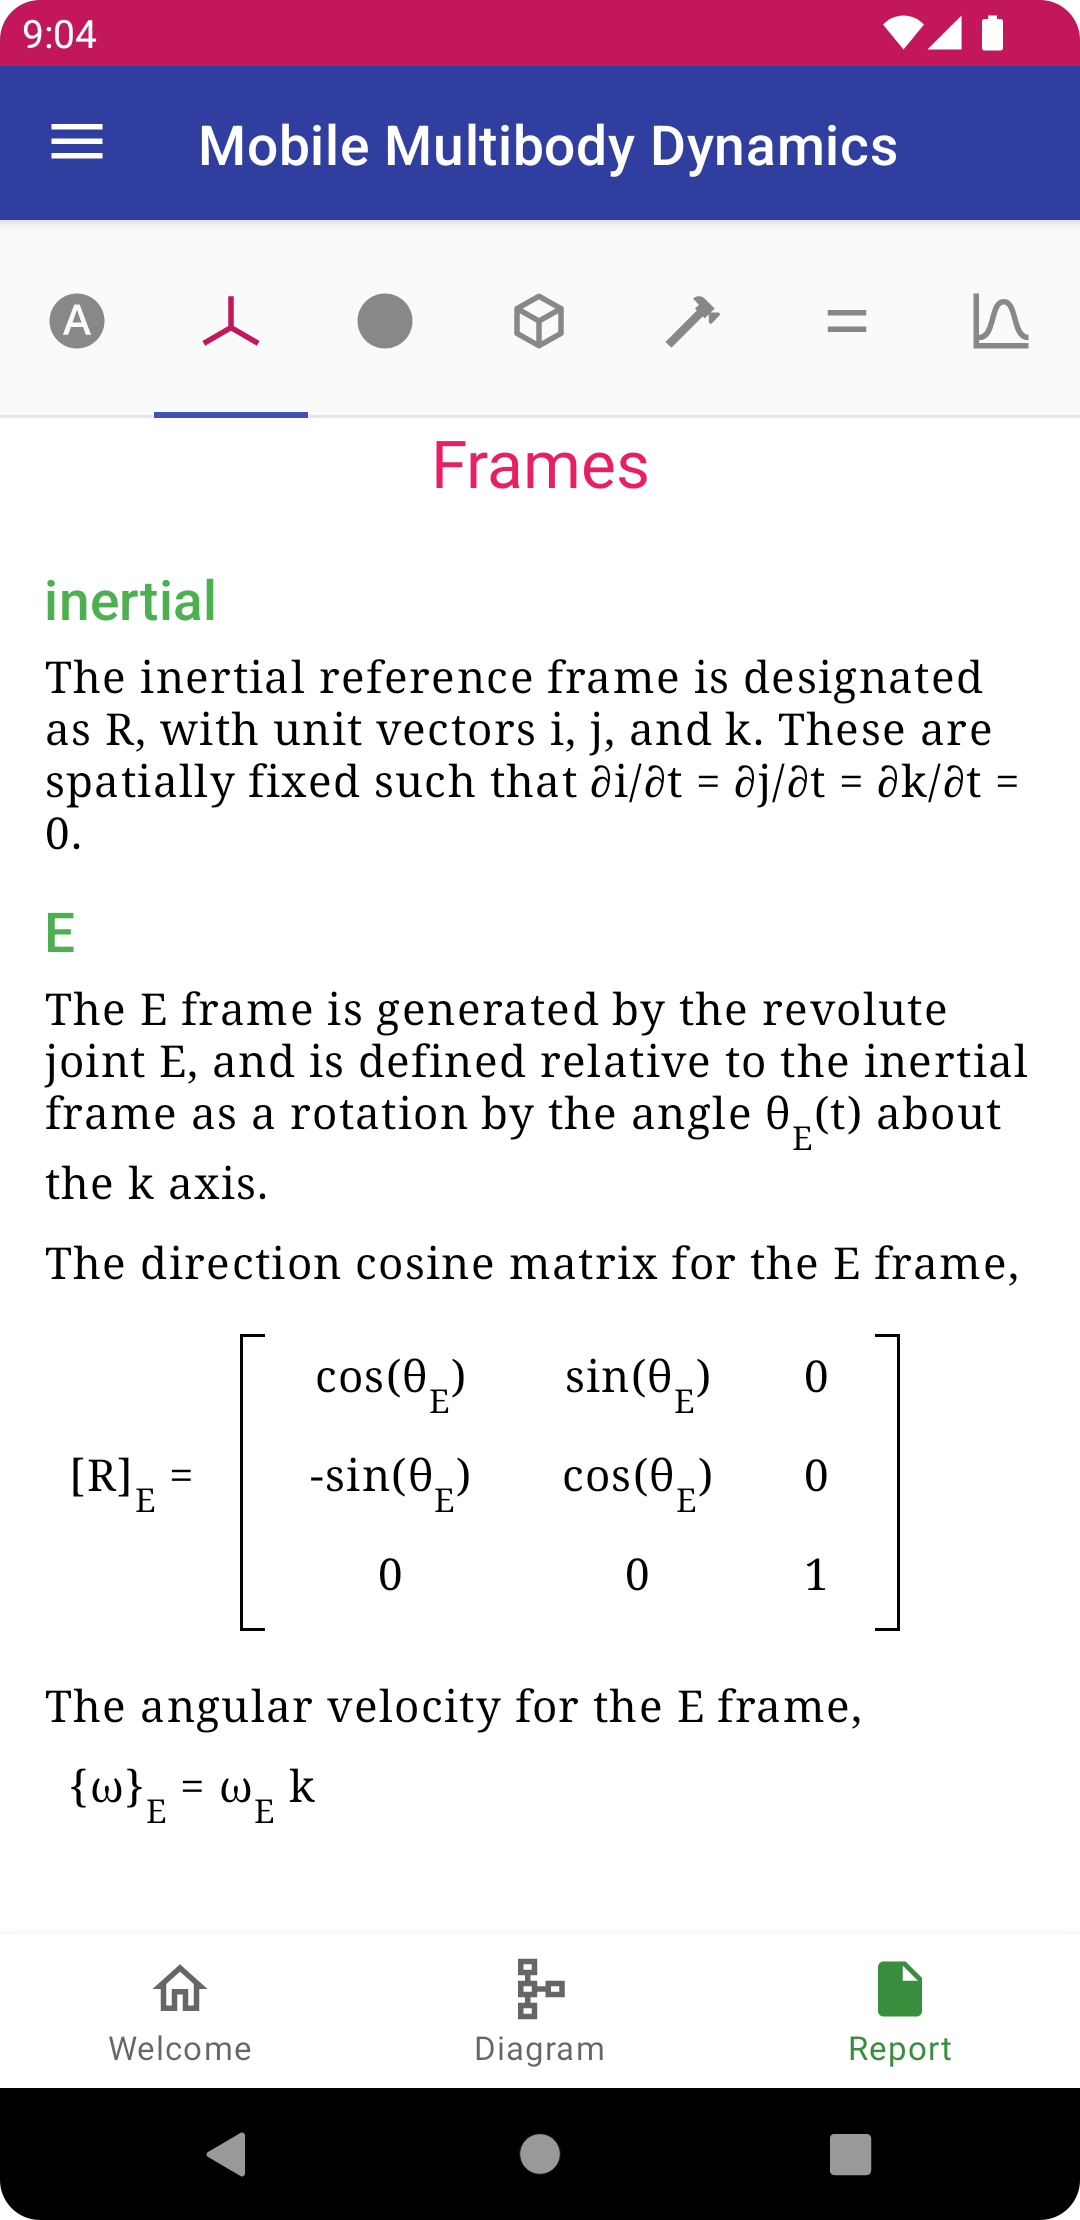
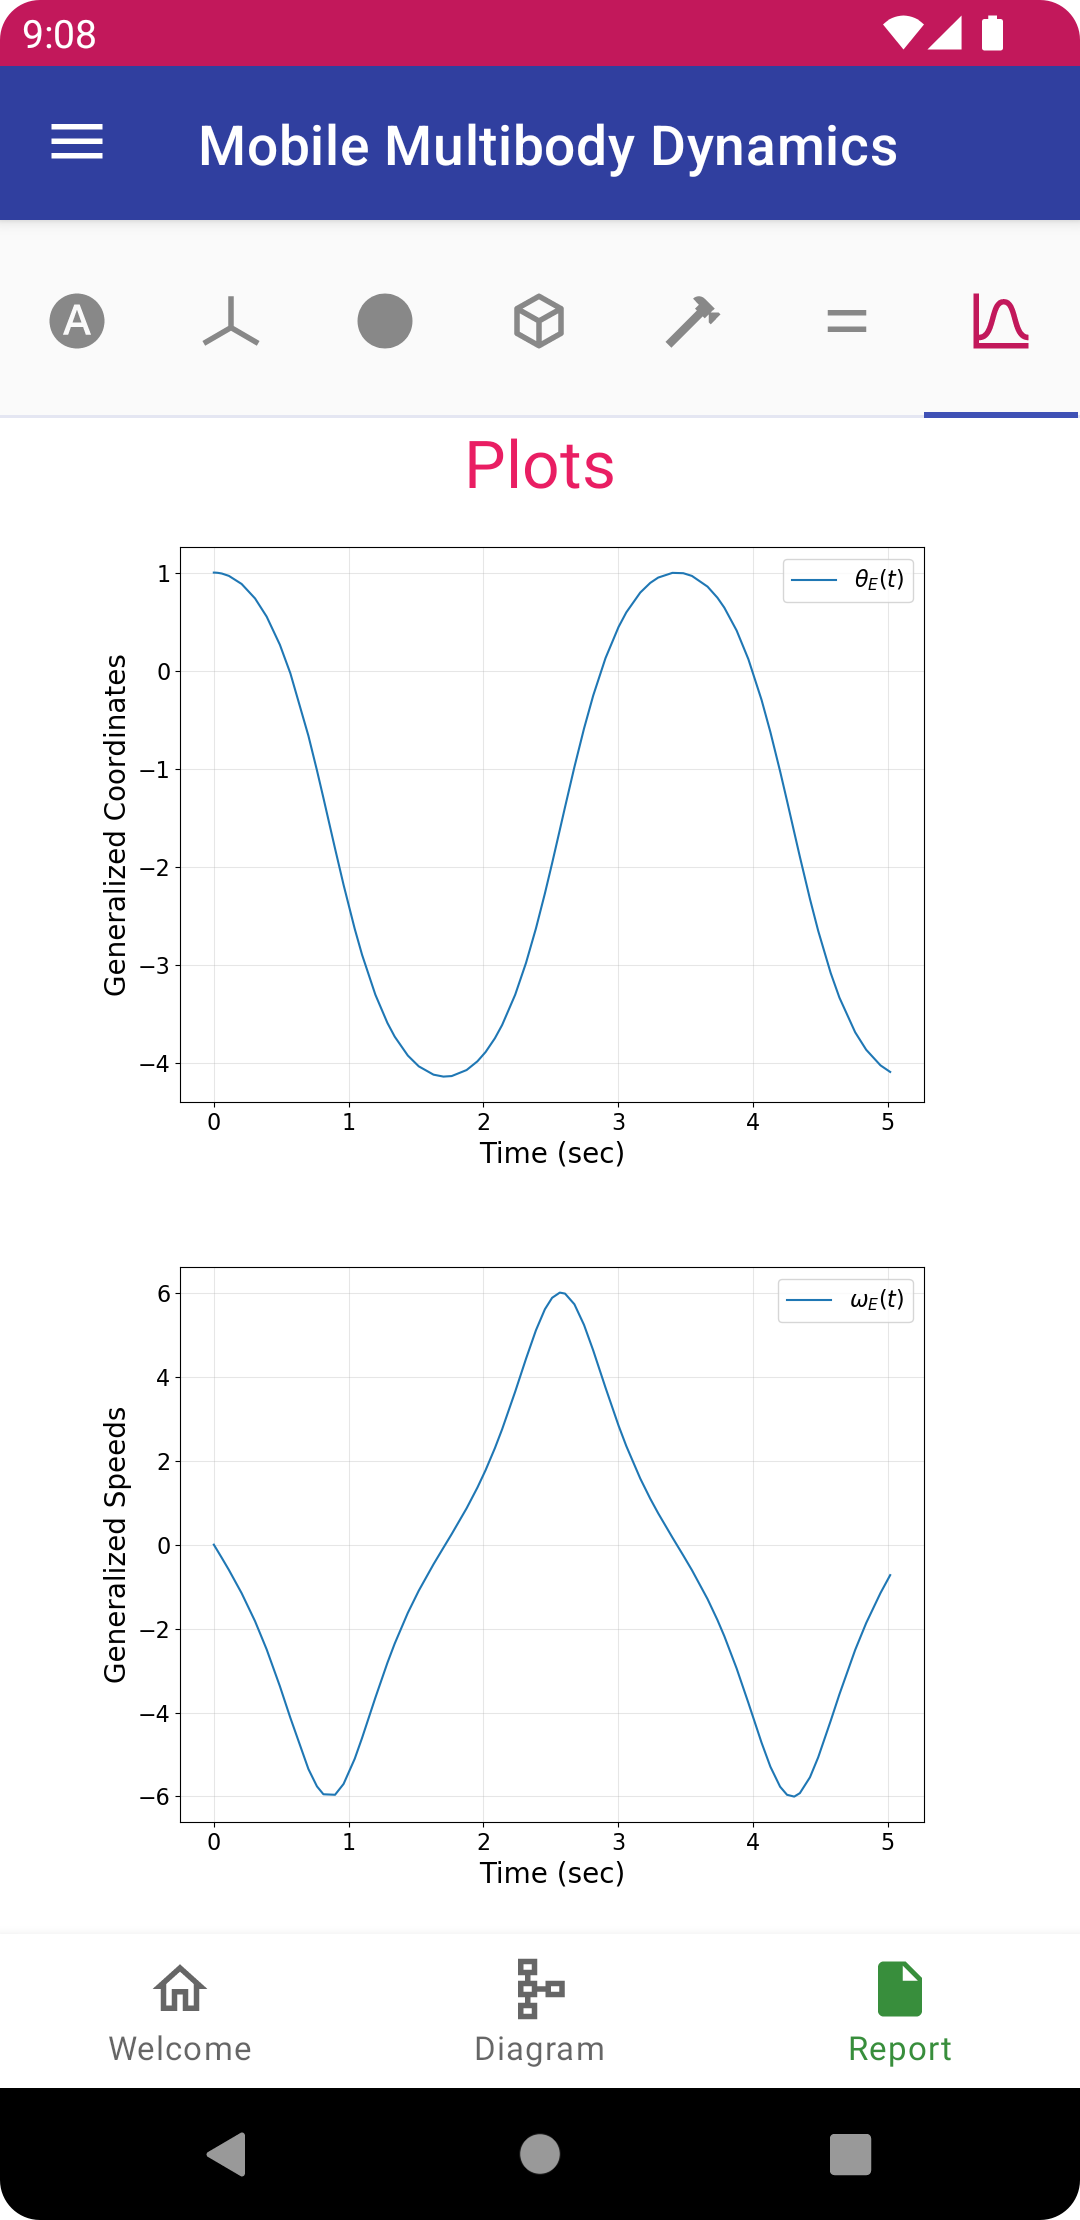
Report View
Provides text and mathematical equations important to the dynamicist. At the top of the screen are several tabs which each direct to a different set of report data. Start with the symbolic variables, including the time-varying generalized coordinates and speeds, and the constant parameters. Next are the kinematics, including rotating reference frames, vectors, and points. This is followed by the bodies and loads. Finally, once the model has been defined, you may derive EOM which are viewed with the second to last button, and with these EOM run a simulation with plotted data shown with the last button.